
Time series data mining: 6 applications
Published:
Businesses and organizations generate a high volume of data every single day – be it sales figure, revenue, traffic, or operating cost. These are valuable information for everyday business decisions and long-term policy development. Despite the tremendous potentials time series data are often under-utilized. Here are 6 ways how temporal data can be used in business analytics.
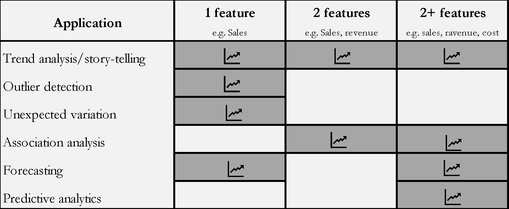
TREND ANALYSIS: One very basic use of time series data is just to understand temporal pattern/trend in business performance. It can even give an early indication on the overall direction of a typical business cycle. Just plotting data against time can generate very powerful insights.
OUTLIER/ANOMALY DETECTION: An outlier in a temporal dataset represents an anomaly. Whether desired (e.g. profit margin) or not (e.g. cost), outliers detected in a dataset can help prevent unintended consequences.
EXAMINING SHOCKS/UNEXPECTED OUTCOMES: Time series data often helps identify variations in the trends (expected or unexpected), any abnormality, and help detect signals in the noise.
ASSOCIATION ANALYSIS: By plotting bivariate/multivariate temporal data it is easy to identify associations between any two features (e.g. profit vs sales). This association may or may not imply causation, but this is a good starting point in selecting input features that impact output variables in more advanced statistical analysis.
FORECASTING: Forecasting future values using historical data is a common methodological approach – be it simple extrapolation or sophisticated stochastic method such as ARIMA.
PREDICTIVE ANALYTICS: Advanced statistical analysis such as panel data models (e.g. fixed and random effects models) rely heavily on multivariate longitudinal datasets. These types of analysis help in doing business forecasting, detect explanatory variables, or simply help understand association between different features in a dataset.